Noise Simulation option consists of Pre-processor (for data input), main processor (for simulation) and Post-processor (for presenting result).
Pre-processor
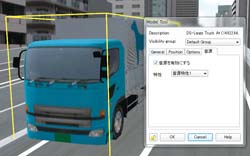
Considering the reduction of the operation workload such as model placement, complicated noise simulation has been enabled through few operation steps and the configuration of simulation specifications. As for the placement of the sound source, configuration is completed only by selecting arbitrary model, toggling sound on or off and selecting characteristics of the sound source. As for the placement of sound receiving point, multiple points can be placed along an arbitrary road at once, for example, as well as placing the point one by one. In addition, it has a convenient function, which allows searching sound sources and receiving points in wide area.
Main processor
The product provides you with abundant analysis option varying from general setting to advanced configuration.
It allows you to obtain precise analysis results according to wide variety of purposes.
In addition, the main analysis content in this main processor is as follows.
- To determine the number and order of diffraction, reflection, penetration
and attenuation of each radiation path
- Fading of sound pressure level according to the distances between the sound
source position and the sound receiving point
- Allowance of frequency weighting characteristics.
*A characteristic is the coefficient for correcting data collected by sound pickup device for human beings to hear.
- To combine the frequency of sound pressure level for each sound receiving
point
- To combine the sound pressure level when the sound of multiple paths reach
the receiving point
- To calculate equivalent continuous A-weighted sound pressure level (1998
the Environment Agency Notification No. 64)
Post-processor
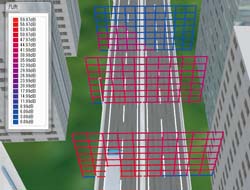
Rich display options help you to capture the simulation results from various
viewpoints. In addition to contours and contour lines commonly used for
presenting the simulation results, the option also has a unique ability:
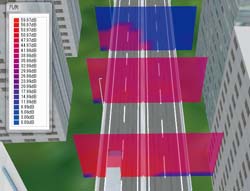
visualizing sound pressure level by grid or sphere shape.(Figure3~6)
 |
|
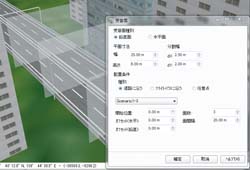 |
 Figure1 Locating sound source Figure1 Locating sound source |
|
 Figure2 Placing points at once Figure2 Placing points at once |
 |
|
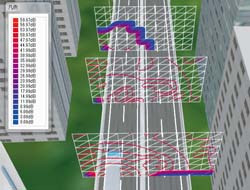 |
 Figure3 Visualization by contours Figure3 Visualization by contours |
|
 Figure4 Visualization by contour lines Figure4 Visualization by contour lines |
 |
|
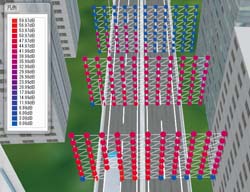 |
 Figure5 Visualization with grid Figure5 Visualization with grid |
|
 Figure6 Visualization with sphere shapes Figure6 Visualization with sphere shapes |
|
